
The Monthly Natural Gas Market Newsletter - February Report
NYMEX March 2022
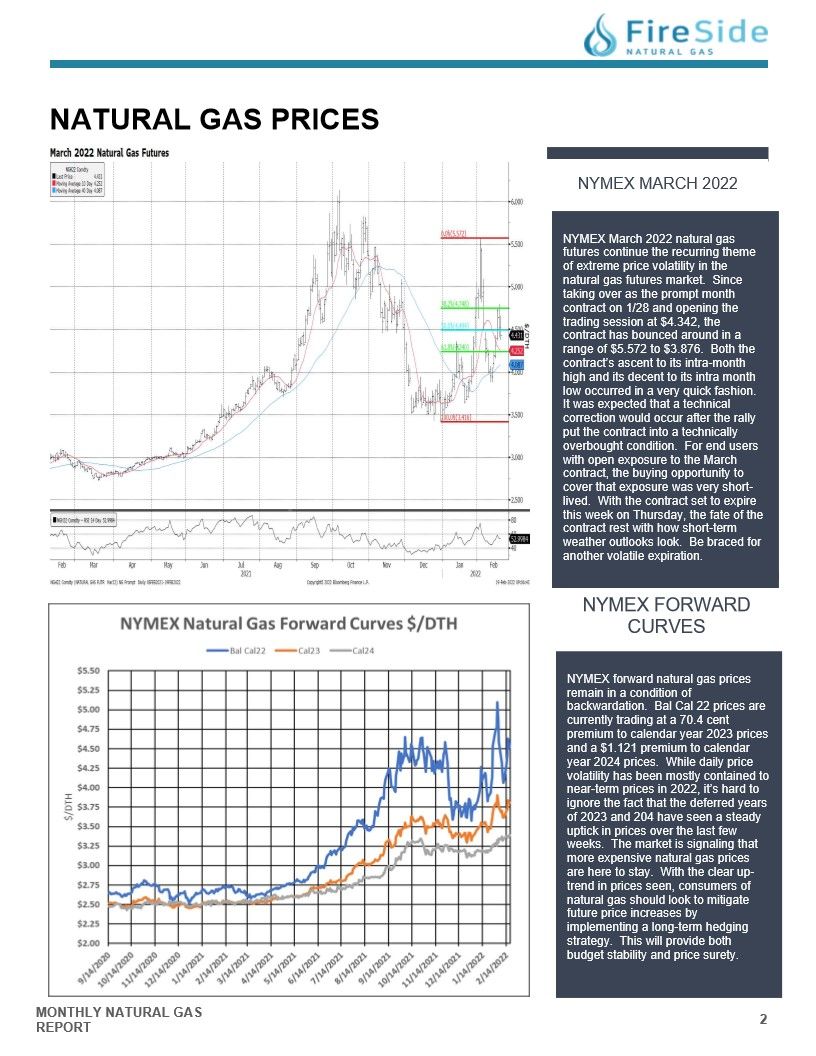
NYMEX March 2022 natural gas
futures continue the recurring theme
of extreme price volatility in the
natural gas futures market. Since
taking over as the prompt month
contract on 1/28 and opening the
trading session at $4.342, the
contract has bounced around in a
range of $5.572 to $3.876. Both the
contract's ascent to its intra-month
high and its decent to its intra month
low occurred in a very quick fashion.
It was expected that a technical
correction would occur after the rally
put the contract into a technically
overbought condition. For end users
with open exposure to the March
contract, the buying opportunity to
cover that exposure was very shortlived. With the contract set to expire
this week on Thursday, the fate of the
contract rest with how short-term
weather outlooks look. Be braced for
another volatile expiration.
NYMEX FORWARD CURVES
NYMEX forward natural gas prices
remain in a condition of
backwardation. Bal Cal 22 prices are
currently trading at a 70.4 cent
premium to calendar year 2023 prices
and a $1.121 premium to calendar
year 2024 prices. While daily price
volatility has been mostly contained to
near-term prices in 2022, it's hard to
ignore the fact that the deferred years
of 2023 and 204 have seen a steady
uptick in prices over the last few
weeks. The market is signaling that
more expensive natural gas prices
are here to stay. With the clear uptrend in prices seen, consumers of
natural gas should look to mitigate
future price increases by
implementing a long-term hedging
strategy. This will provide both
budget stability and price surety.
NATURAL GAS SUPPLY - US PRODUCTION
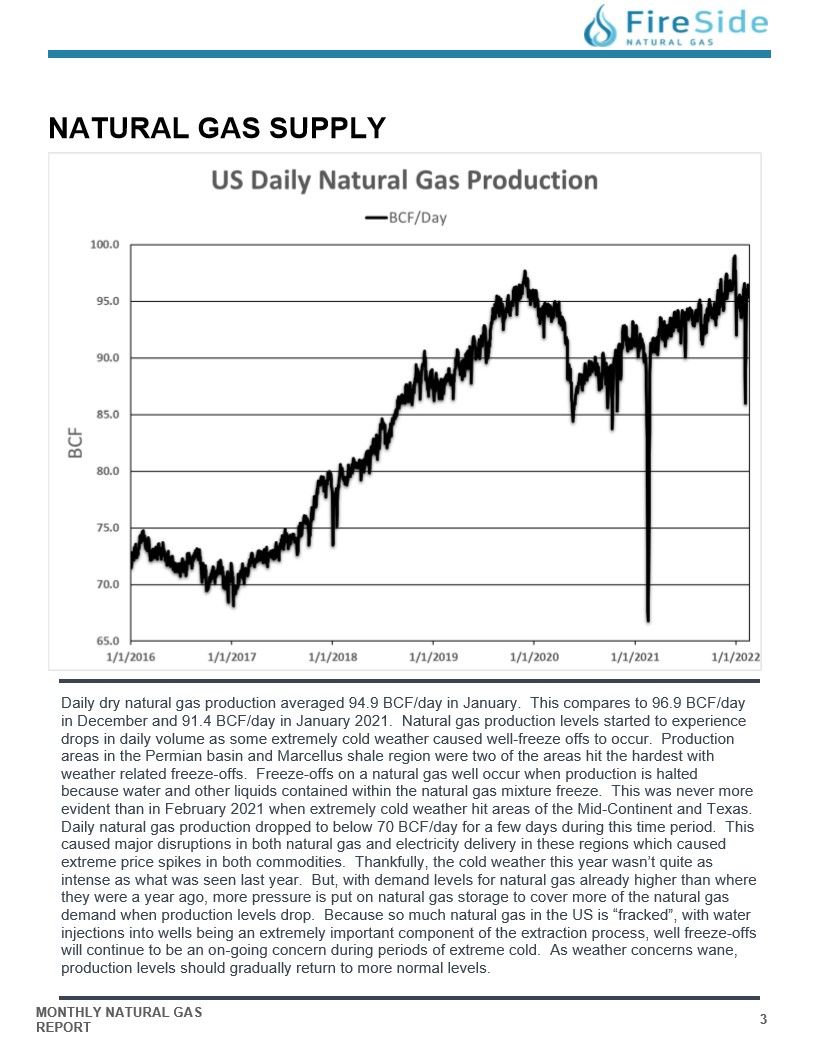
Daily dry natural gas production averaged 94.9 BCF/day in January. This compares to 96.9 BCF/day
in December and 91.4 BCF/day in January 2021. Natural gas production levels started to experience
drops in daily volume as some extremely cold weather caused well-freeze offs to occur. Production
areas in the Permian basin and Marcellus shale region were two of the areas hit the hardest with
weather related freeze-offs. Freeze-offs on a natural gas well occur when production is halted
because water and other liquids contained within the natural gas mixture freeze. This was never more
evident than in February 2021 when extremely cold weather hit areas of the Mid-Continent and Texas.
Daily natural gas production dropped to below 70 BCF/day for a few days during this time period. This
caused major disruptions in both natural gas and electricity delivery in these regions which caused
extreme price spikes in both commodities. Thankfully, the cold weather this year wasn't quite as
intense as what was seen last year. But, with demand levels for natural gas already higher than where
they were a year ago, more pressure is put on natural gas storage to cover more of the natural gas
demand when production levels drop. Because so much natural gas in the US is "fracked", with water
injections into wells being an extremely important component of the extraction process, well freeze-offs
will continue to be an on-going concern during periods of extreme cold. As weather concerns wane,
production levels should gradually return to more normal levels.
BAKER HUGHES RIG COUNT
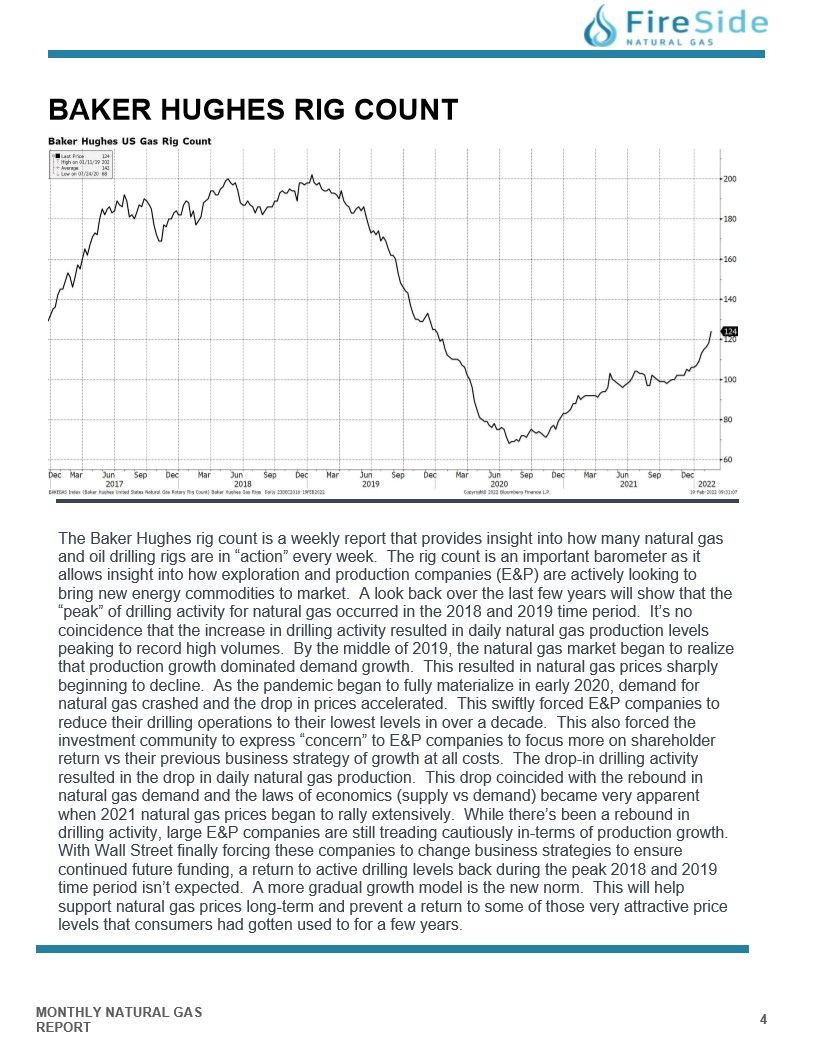
The Baker Hughes rig count is a weekly report that provides insight into how many natural gas
and oil drilling rigs are in "action" every week. The rig count is an important barometer as it
allows insight into how exploration and production companies (E&P) are actively looking to
bring new energy commodities to market. A look back over the last few years will show that the
"peak" of drilling activity for natural gas occurred in the 2018 and 2019 time period. It's no
coincidence that the increase in drilling activity resulted in daily natural gas production levels
peaking to record high volumes. By the middle of 2019, the natural gas market began to realize
that production growth dominated demand growth. This resulted in natural gas prices sharply
beginning to decline. As the pandemic began to fully materialize in early 2020, demand for
natural gas crashed and the drop in prices accelerated. This swiftly forced E&P companies to
reduce their drilling operations to their lowest levels in over a decade. This also forced the
investment community to express "concern" to E&P companies to focus more on shareholder
return vs their previous business strategy of growth at all costs. The drop-in drilling activity
resulted in the drop in daily natural gas production. This drop coincided with the rebound in
natural gas demand and the laws of economics (supply vs demand) became very apparent
when 2021 natural gas prices began to rally extensively. While there's been a rebound in
drilling activity, large E&P companies are still treading cautiously in-terms of production growth.
With Wall Street finally forcing these companies to change business strategies to ensure
continued future funding, a return to active drilling levels back during the peak 2018 and 2019
time period isn't expected. A more gradual growth model is the new norm. This will help
support natural gas prices long-term and prevent a return to some of those very attractive price
levels that consumers had gotten used to for a few years.
NATURAL GAS STORAGE - STORAGE ANALYSIS
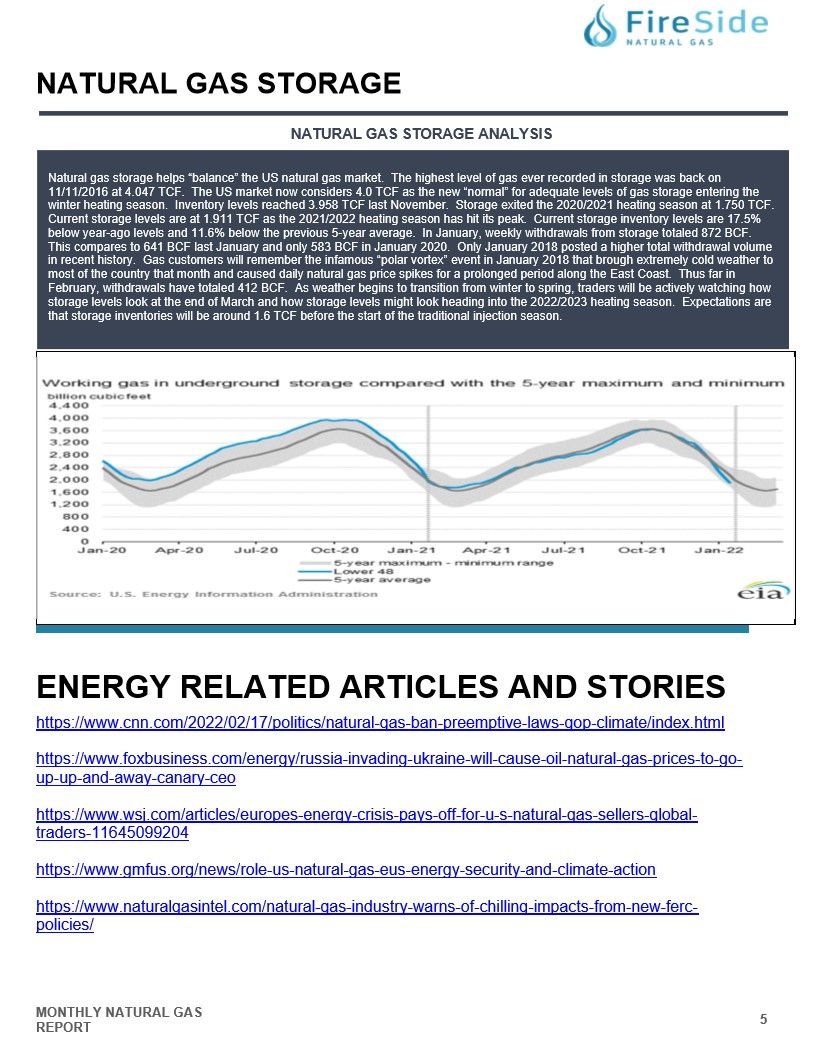
Natural gas storage helps "balance" the US natural gas market. The highest level of gas ever recorded in storage was back on 11/11/2016 at 4.047 TCF. The US market now considers 4.0 TCF as the new "normal" for adequate levels of gas storage entering the winter heating season. Inventory levels reached 3.958 TCF last November. Storage exited the 2020/2021 heating season at 1.750 TCF. Current storage levels are at 1.911 TCF as the 2021/2022 heating season has hit its peak. Current storage inventory levels are 17.5% below year-ago levels and 11.6% below the previous 5-year average. In January, weekly withdrawals from storage totaled 872 BCF. This compares to 641 BCF last January and only 583 BCF in January 2020. Only January 2018 posted a higher total withdrawal volume in recent history. Gas customers will remember the infamous "polar vortex" event in January 2018 that brough extremely cold weather to most of the country that month and caused daily natural gas price spikes for a prolonged period along the East Coast. Thus far in February, withdrawals have totaled 412 BCF. As weather begins to transition from winter to spring, traders will be actively watching how storage levels look at the end of March and how storage levels might look heading into the 2022/2023 heating season. Expectations are that storage inventories will be around 1.6 TCF before the start of the traditional injection season.
Energy Related Articles and Stories
https://www.cnn.com/2022/02/17/politics/natural-gas-ban-preemptive-laws-gop-climate/index.html
https://www.gmfus.org/news/role-us-natural-gas-eus-energy-security-and-climate-action