
FireSide Monthly Natural Gas Report - February
FireSide Natural Gas Monthly Report - February 2023
Natural Gas Prices
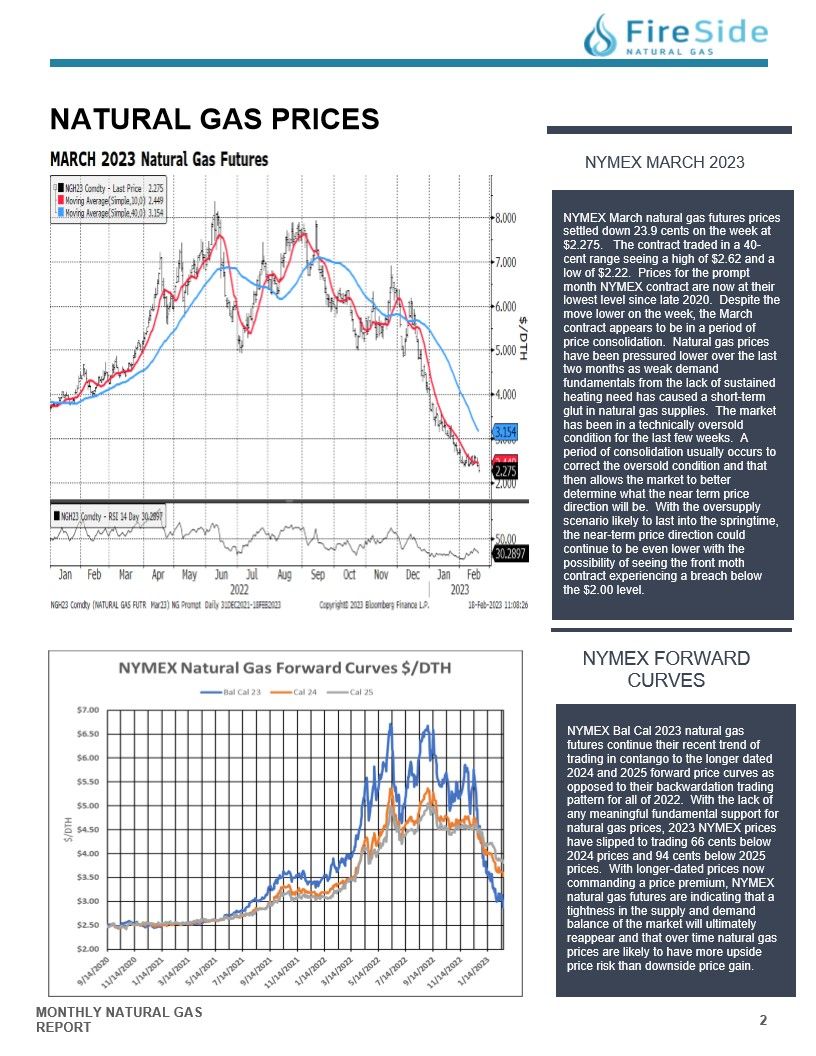
NYMEX MARCH 2023
NYMEX March natural gas futures prices settled down 23.9 cents on the week at $2.275. The contract traded in a 40- cent range seeing a high of $2.62 and a low of $2.22. Prices for the prompt month NYMEX contract are now at their lowest level since late 2020. Despite the move lower on the week, the March contract appears to be in a period of price consolidation. Natural gas prices have been pressured lower over the last two months as weak demand fundamentals from the lack of sustained heating need has caused a short-term glut in natural gas supplies. The market has been in a technically oversold condition for the last few weeks. A period of consolidation usually occurs to correct the oversold condition and that then allows the market to better determine what the near term price direction will be. With the oversupply scenario likely to last into the springtime, the near-term price direction could continue to be even lower with the possibility of seeing the front moth contract experiencing a breach below the $2.00 level.
NYMEX FORWARD CURVES
NYMEX Bal Cal 2023 natural gas
futures continue their recent trend of
trading in contango to the longer dated
2024 and 2025 forward price curves as
opposed to their backwardation trading
pattern for all of 2022. With the lack of
any meaningful fundamental support for
natural gas prices, 2023 NYMEX prices
have slipped to trading 66 cents below
2024 prices and 94 cents below 2025
prices. With longer-dated prices now
commanding a price premium, NYMEX
natural gas futures are indicating that a
tightness in the supply and demand
balance of the market will ultimately
reappear and that over time natural gas
prices are likely to have more upside
price risk than downside price gain.
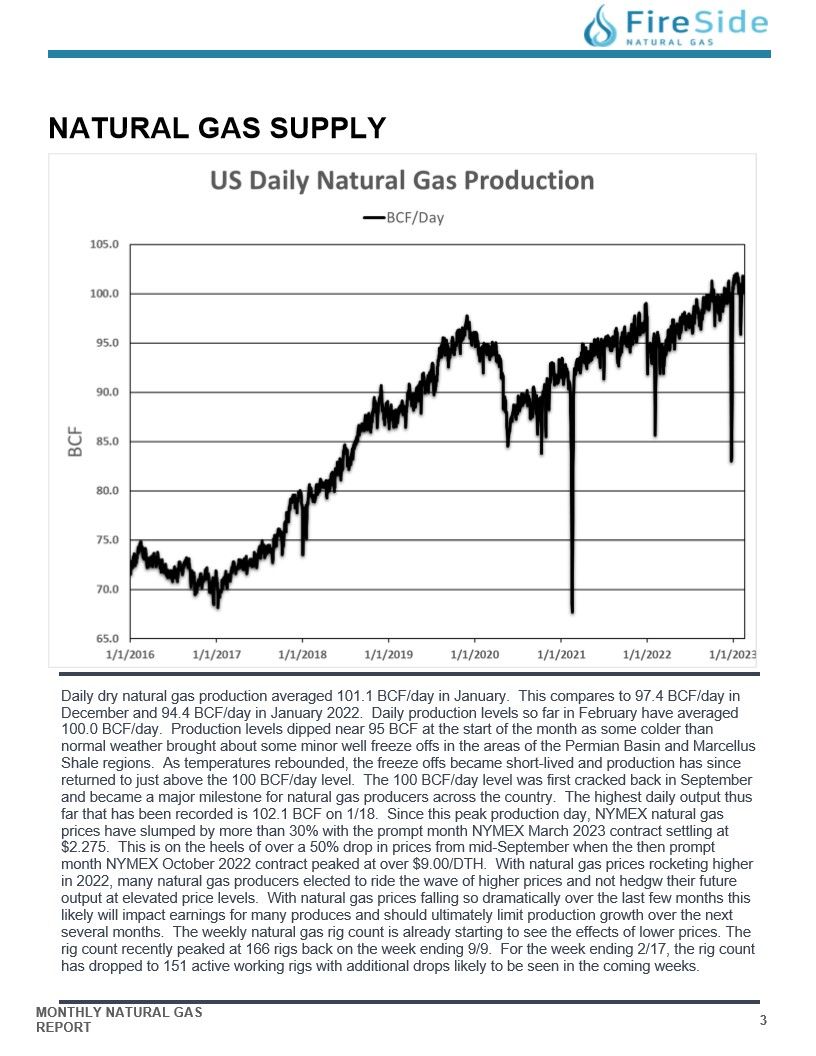
US DAILEY NATURAL GAS PRODUCTION
Daily dry natural gas production averaged 101.1 BCF/day in January. This compares to 97.4 BCF/day in
December and 94.4 BCF/day in January 2022. Daily production levels so far in February have averaged
100.0 BCF/day. Production levels dipped near 95 BCF at the start of the month as some colder than
normal weather brought about some minor well freeze offs in the areas of the Permian Basin and Marcellus
Shale regions. As temperatures rebounded, the freeze offs became short-lived and production has since
returned to just above the 100 BCF/day level. The 100 BCF/day level was first cracked back in September
and became a major milestone for natural gas producers across the country. The highest daily output thus
far that has been recorded is 102.1 BCF on 1/18. Since this peak production day, NYMEX natural gas
prices have slumped by more than 30% with the prompt month NYMEX March 2023 contract settling at
$2.275. This is on the heels of over a 50% drop in prices from mid-September when the then prompt
month NYMEX October 2022 contract peaked at over $9.00/DTH. With natural gas prices rocketing higher
in 2022, many natural gas producers elected to ride the wave of higher prices and not hedgw their future
output at elevated price levels. With natural gas prices falling so dramatically over the last few months this
likely will impact earnings for many produces and should ultimately limit production growth over the next
several months. The weekly natural gas rig count is already starting to see the effects of lower prices. The
rig count recently peaked at 166 rigs back on the week ending 9/9. For the week ending 2/17, the rig count
has dropped to 151 active working rigs with additional drops likely to be seen in the coming weeks.
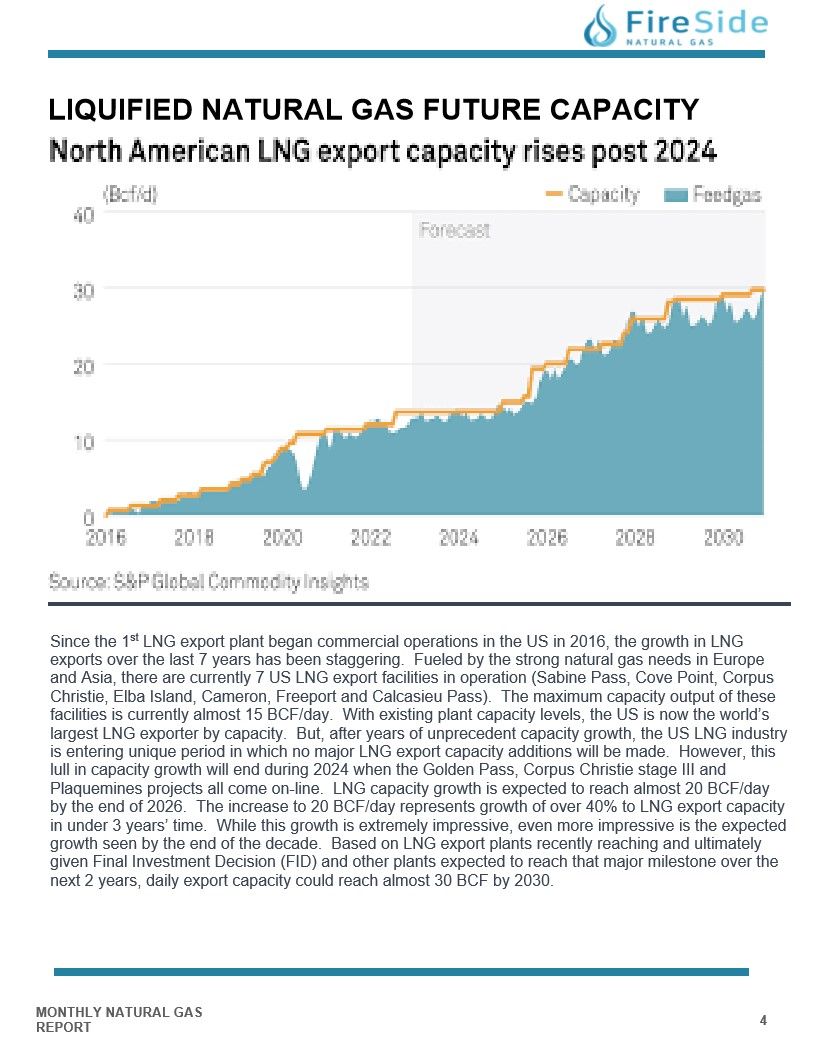
LIQUIFIED NATURAL GAS FUTURE CAPACITY
Since the 1st LNG export plant began commercial operations in the US in 2016, the growth in LNG exports over the last 7 years has been staggering. Fueled by the strong natural gas needs in Europe and Asia, there are currently 7 US LNG export facilities in operation (Sabine Pass, Cove Point, Corpus Christie, Elba Island, Cameron, Freeport and Calcasieu Pass). The maximum capacity output of these facilities is currently almost 15 BCF/day. With existing plant capacity levels, the US is now the world's largest LNG exporter by capacity. But, after years of unprecedent capacity growth, the US LNG industry is entering unique period in which no major LNG export capacity additions will be made. However, this lull in capacity growth will end during 2024 when the Golden Pass, Corpus Christie stage III and Plaquemines projects all come on-line. LNG capacity growth is expected to reach almost 20 BCF/day by the end of 2026. The increase to 20 BCF/day represents growth of over 40% to LNG export capacity in under 3 years' time. While this growth is extremely impressive, even more impressive is the expected growth seen by the end of the decade. Based on LNG export plants recently reaching and ultimately given Final Investment Decision (FID) and other plants expected to reach that major milestone over the next 2 years, daily export capacity could reach almost 30 BCF by 2030.
NATURAL GAS STORAGE
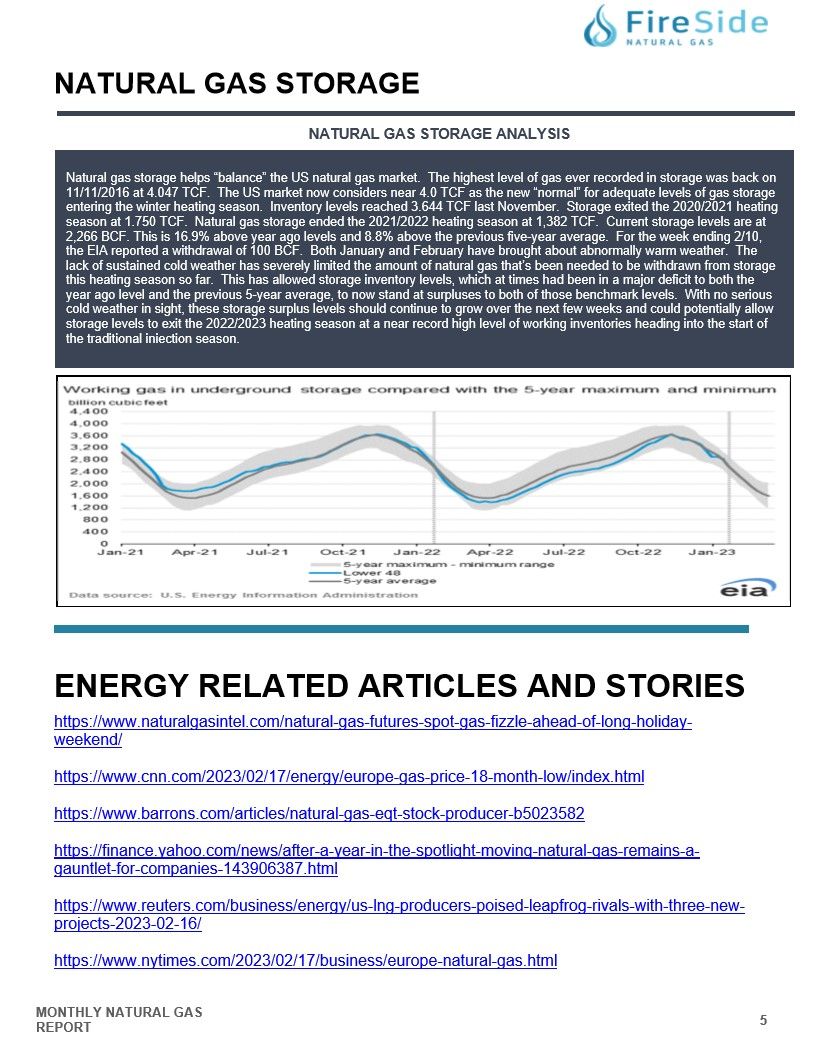
Natural gas storage helps "balance" the US natural gas market. The highest level of gas ever recorded in storage was back on
11/11/2016 at 4.047 TCF. The US market now considers near 4.0 TCF as the new "normal" for adequate levels of gas storage
entering the winter heating season. Inventory levels reached 3.644 TCF last November. Storage exited the 2020/2021 heating
season at 1.750 TCF. Natural gas storage ended the 2021/2022 heating season at 1,382 TCF. Current storage levels are at
2,266 BCF. This is 16.9% above year ago levels and 8.8% above the previous five-year average. For the week ending 2/10,
the EIA reported a withdrawal of 100 BCF. Both January and February have brought about abnormally warm weather. The
lack of sustained cold weather has severely limited the amount of natural gas that's been needed to be withdrawn from storage
this heating season so far. This has allowed storage inventory levels, which at times had been in a major deficit to both the
year ago level and the previous 5-year average, to now stand at surpluses to both of those benchmark levels. With no serious
cold weather in sight, these storage surplus levels should continue to grow over the next few weeks and could potentially allow
storage levels to exit the 2022/2023 heating season at a near record high level of working inventories heading into the start of
the traditional injection season.